Projects
A few of the projects and technologies that I've created and used recently.
River Gage
Over the past several years, I have been building a low cost river gage [1] and associated web site.
The goal of the project is to create a system that enables communities and individuals monitor their local waterways at a low cost.
The Gage
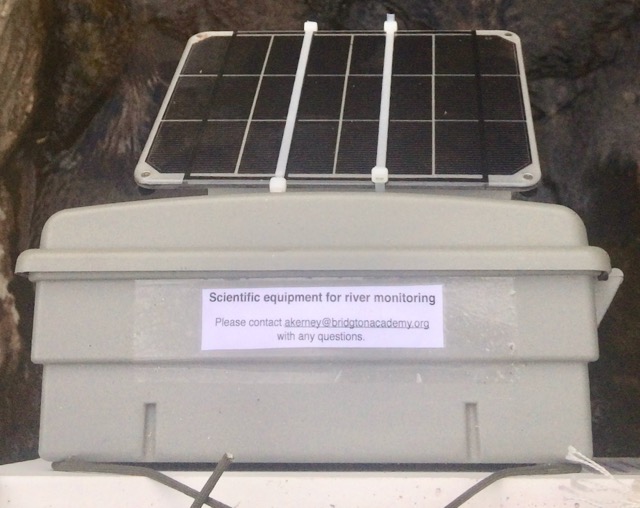
After looking through a range of solutions including camera and capacitive based systems, I chose to base the hardware around a BeagleBone Black single board computer and a MaxBotix ultrasonic sensor. The ultrasonic sensor allows the whole system to be relatively compact and mounted in a single unit above the water surface. It also uses a minimal amount of power and data to transmit compared to other possible solutions.
For power management, I am using a PowerCape from AndiceLabs driven by a small solar array and lithium battery.
I could have designed a much lower power auxiliary chip and circuit to measure samples, but that would have increased the difficulty for other groups to build their own. As is, I went through several generations of hardware to reduce and simplify the wiring and soldering needed.
On the software side of things, I initially had the Beaglebone running Debian. This worked for development of the initial control software, but made it also complicated the setup and management for others to run their own gages.
Now I have chosen to use Resin.io which allows me to specify the on device software with a Docker container. Additionally Resin.io manages software updates, the base operating system, logging, and configuration. For other groups this will dramatically reduce the number of steps necessary to keep their gage's up to date, and to setup in the first place.
RiverFlo.ws
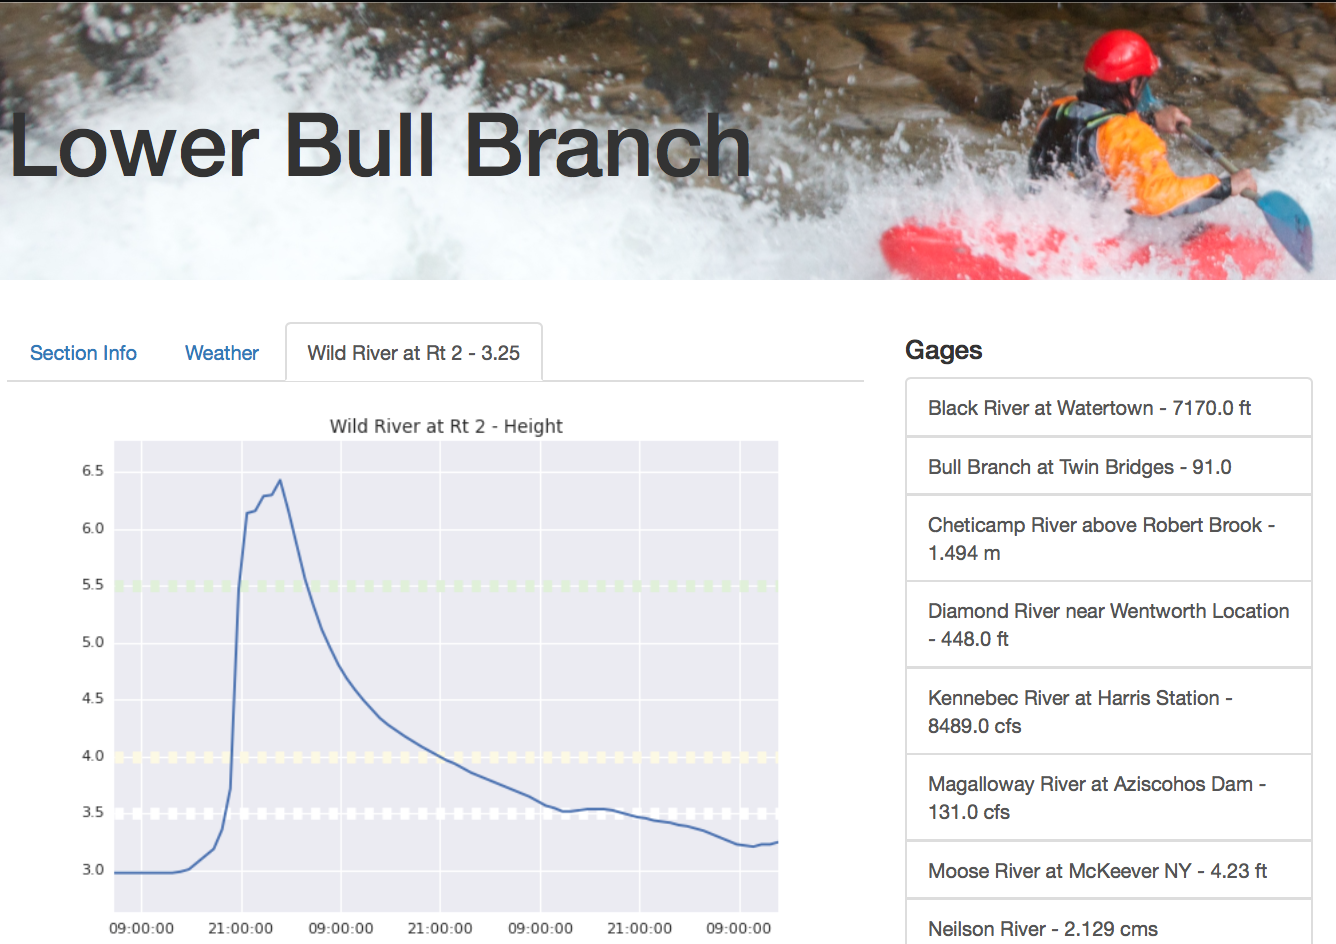
RiverFlo.ws started as a website just to collect data from the river gages that I'm designing.
Quickly it picked up the ability to aggregate river data from the USGS, Army Corps of Engineers, and the Canadian Water Office among other sources allowing easier correlation of stream flows.
Source: https://github.com/abkfenris/gage-web
- Built with:
- Flask
- SQLAlchemy
- Celery
- Bokeh
- Leaflet
- Mapbox
- PostGIS
- Patroni
- WAL-E
- Redis
- Kubernetes
iOS native Resin.io Dashboard
I am currently building an iOS native interface to Resin.io in Swift that is optimized for display both on iPhone and iPad sized screens.
More to come as I get more built out.
Source: https://github.com/abkfenris/ResinDashboard
- Built with:
- Xcode
- Swift
- Core data
- MapKit
- Resin.io
The Whitewater Calendar
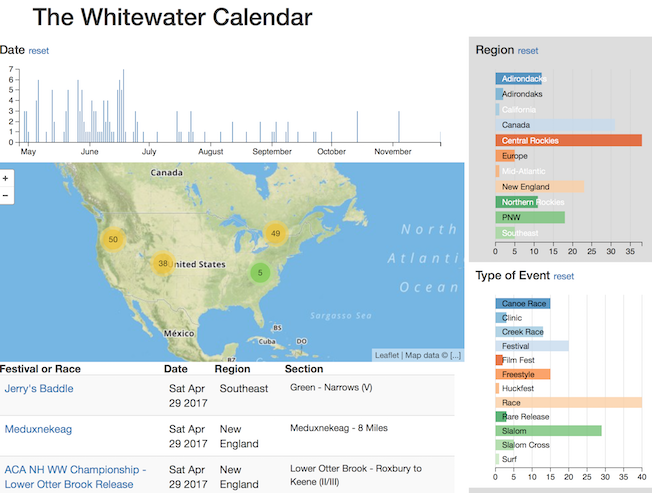
The Whitewater Calendar developed out of a conversation with a few friends who were looking to go on a road trip and explore somewhere new and connect with local paddlers along the way.
Since then it's evolved into a worldwide collection of events, from races to festivals to film premiers, all driven by an easy to update Google Sheet.
Source: https://github.com/abkfenris/whitewater-events
- Built with:
- dc.js
- Mapbox
- Leaflet
- Google Sheets
Sugarloaf Snow Conditions
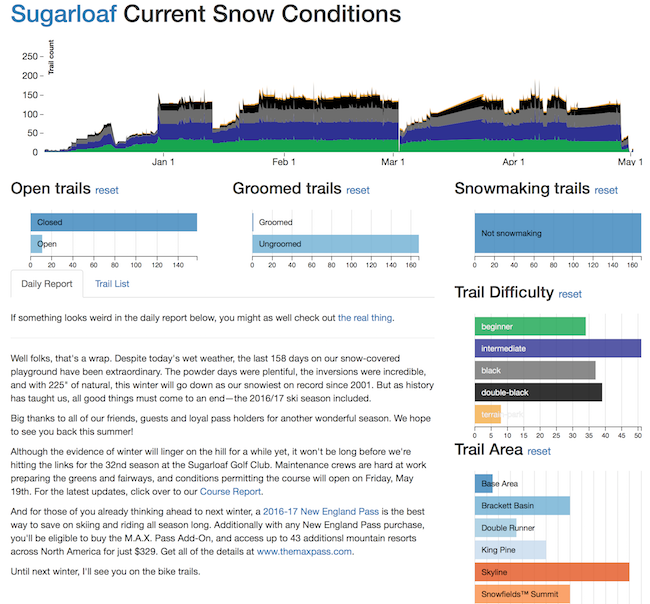
Another conversation left me interested in exploring how the trail count at ski areas was affected by weather patterns.
To start I decided to track and visualize the changes in Sugarloaf's trails through a season.
In the future I would love to expand to other ski areas and regions.
Source: https://github.com/abkfenris/sugarloaf
- Built with:
- Flask
- Celery
- BeautifulSoup
- dc.js
- d3
- PostgreSQL
- Kubernetes
Tuckerman Inferno Race Map
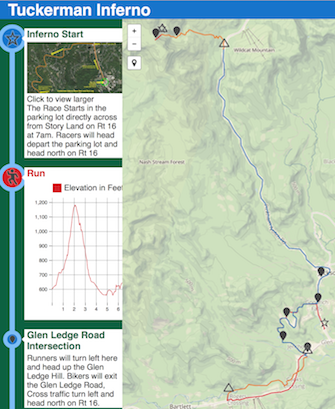
I designed a map for the Friends of Tuckerman Ravine, Tuckerman Inferno Pentathlon to better highlight the different sections (sports and elevations) of the course.
At the same time it needed to be easy and informative for both athlete and spectator access on computers and mobile devices.
Source: https://github.com/abkfenris/inferno-react
- Built with:
- React
- Redux
- Mapbox maps
- Leaflet
- D3
- GeoJSON.io
| [1] | USGS uses gage more often than gauge for streamflow related measurements, so I have chosen to do the same. |